
 Scan With Phone's Bar Code Reader
Current Space Weather
|
|

Current Sunspot Activity
 |
- Sunspots are solar magnetic storms. The spots appear darker because the temperature of the spots are lower than the surrounding photosphere.
- They serve as a reservoir for solar flares and coronal mass ejections, which cause Aurorae, power/communication outages, and satellite anomalies.
- The Sun's activity waxes and wanes in an 11-year sunspot cycle; Solar Minimum is when the number of sunspots are lowest.
- There seems to be a correlation between Solar Min/Maximum and Earth's weather. The extent to which Ozone, stratospheric winds, global circulation patterns, and cloud seeding are all affected are still being studied.
Sunspot graph courtesy: Newquay Weather
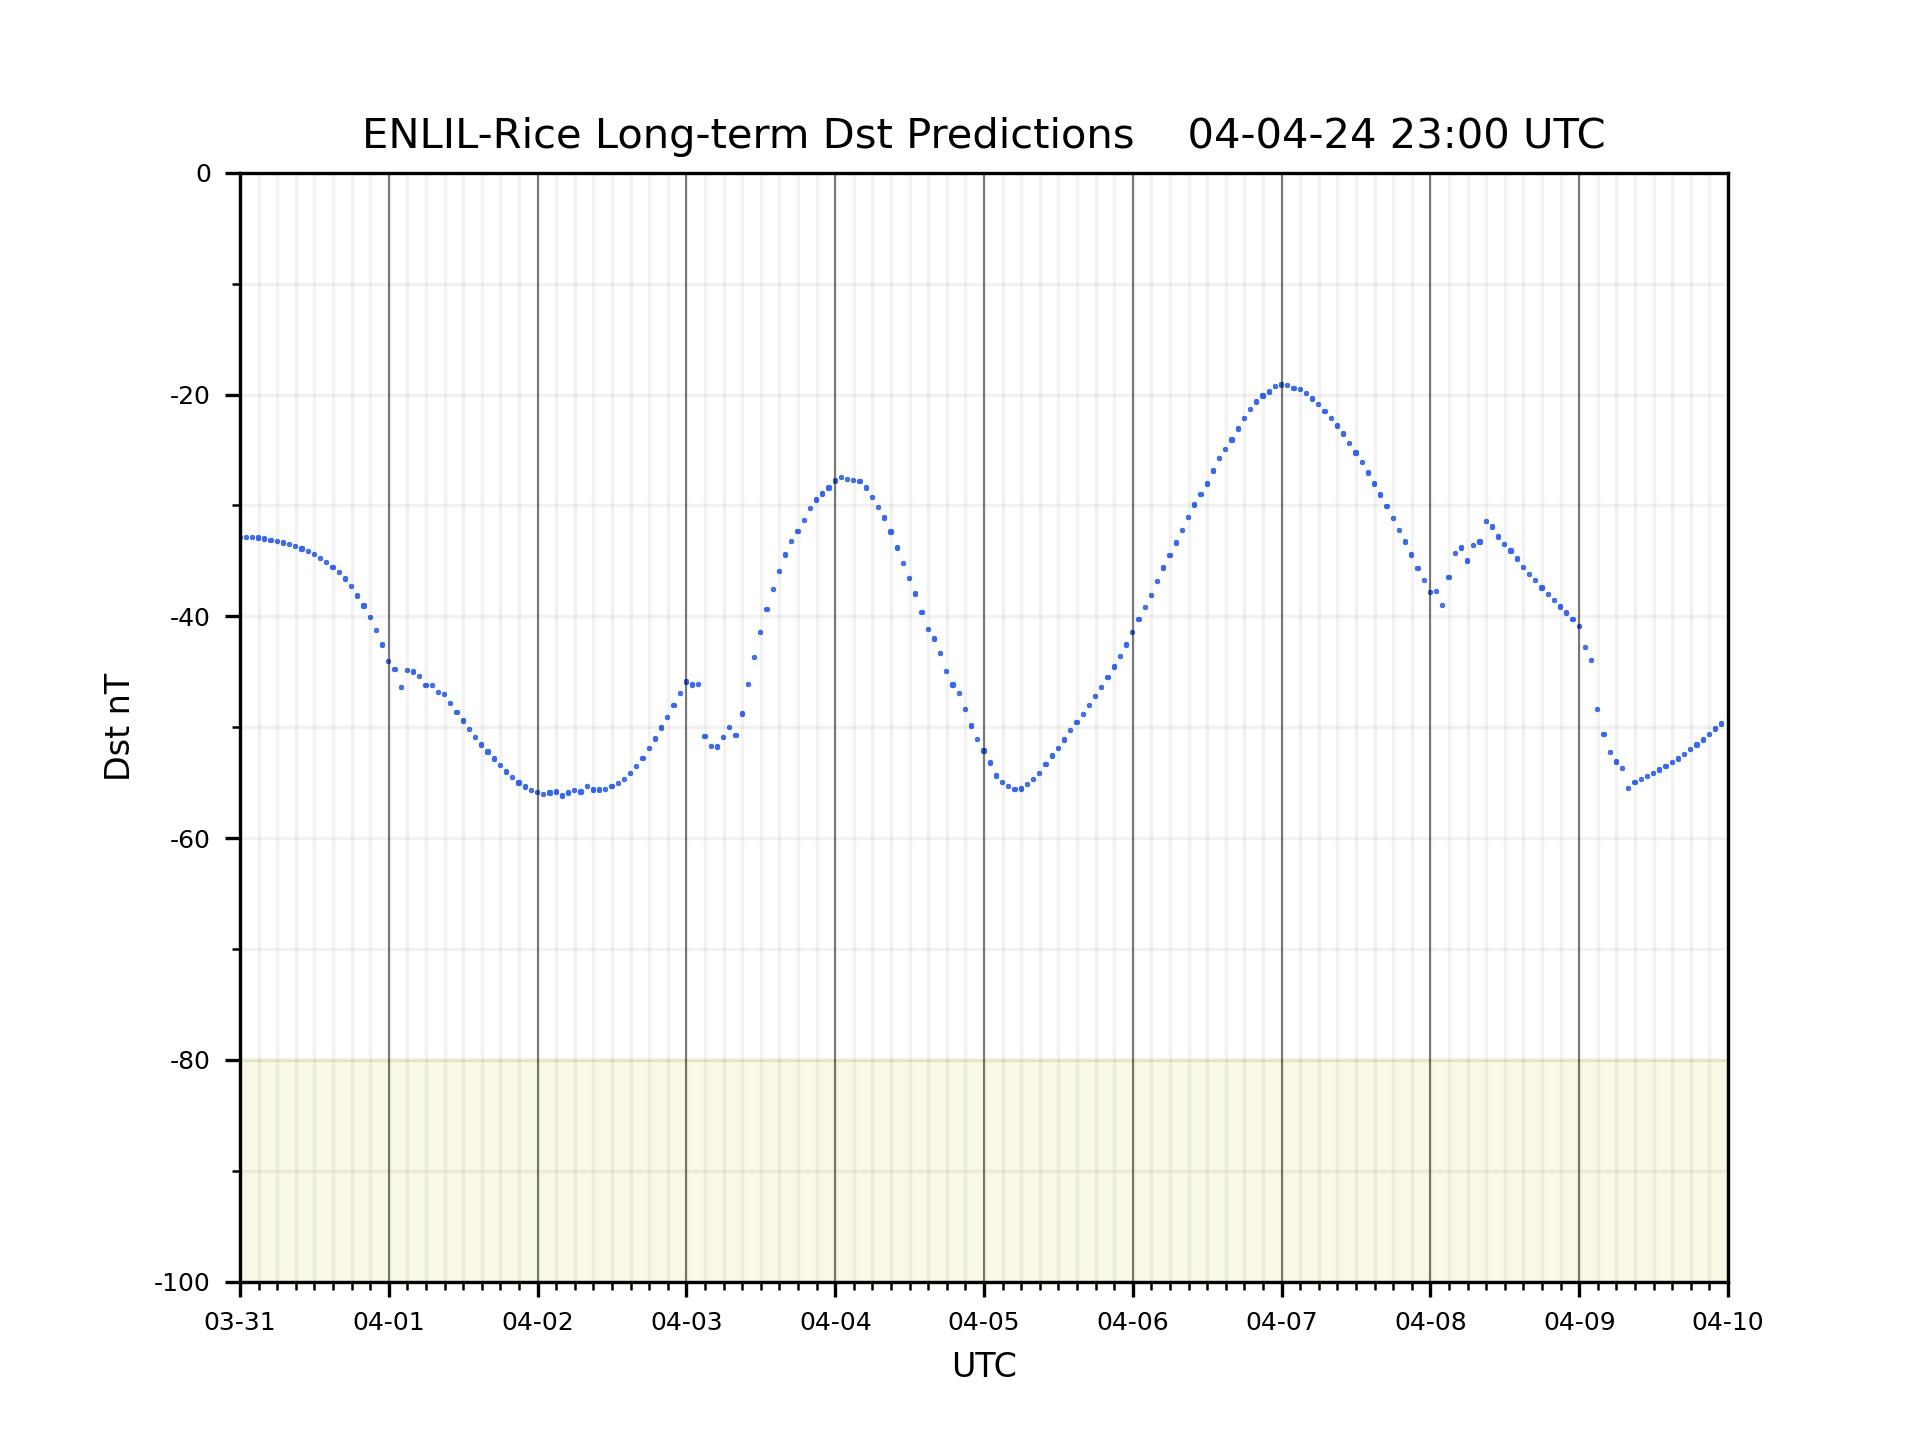
Space Weather Dashboard
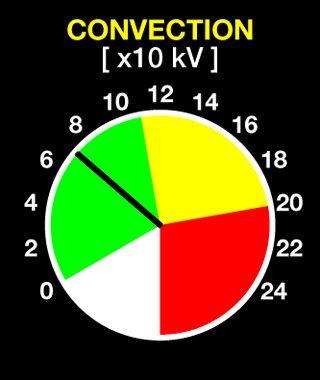
Interplanetary Magnetic Field
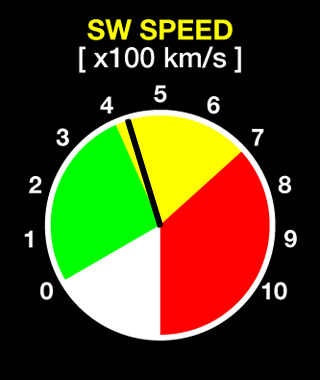
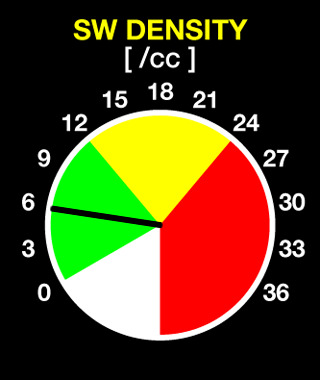
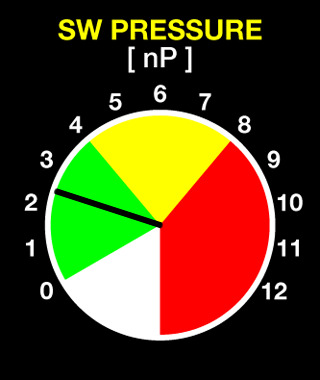
 This Image Illustrates Solar Wind pressure on Earth's Magnetosphere. |


IMF Dials and Graphs Courtesy: MMS at Rice |
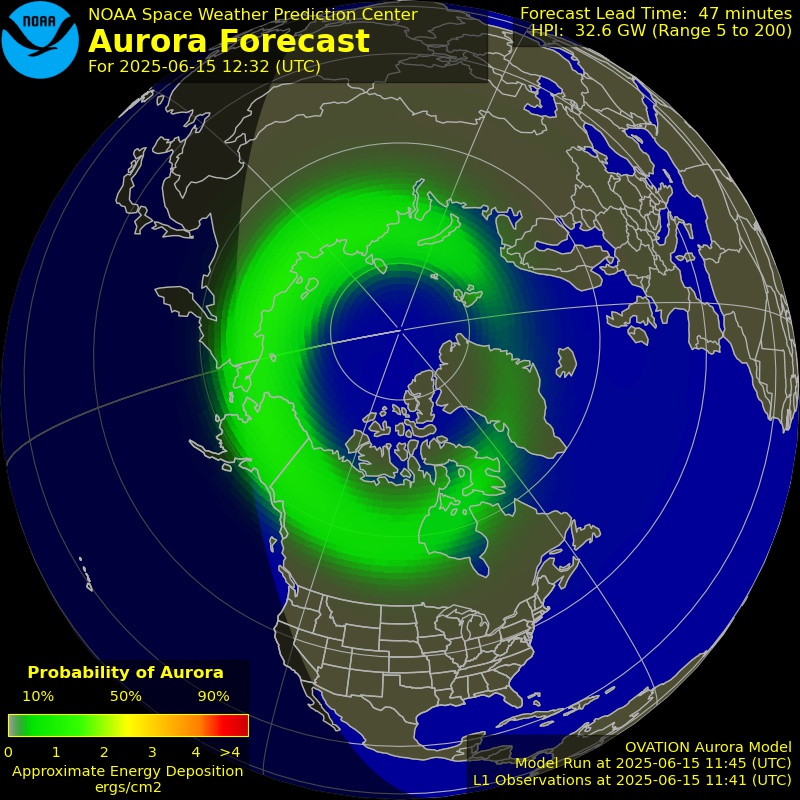
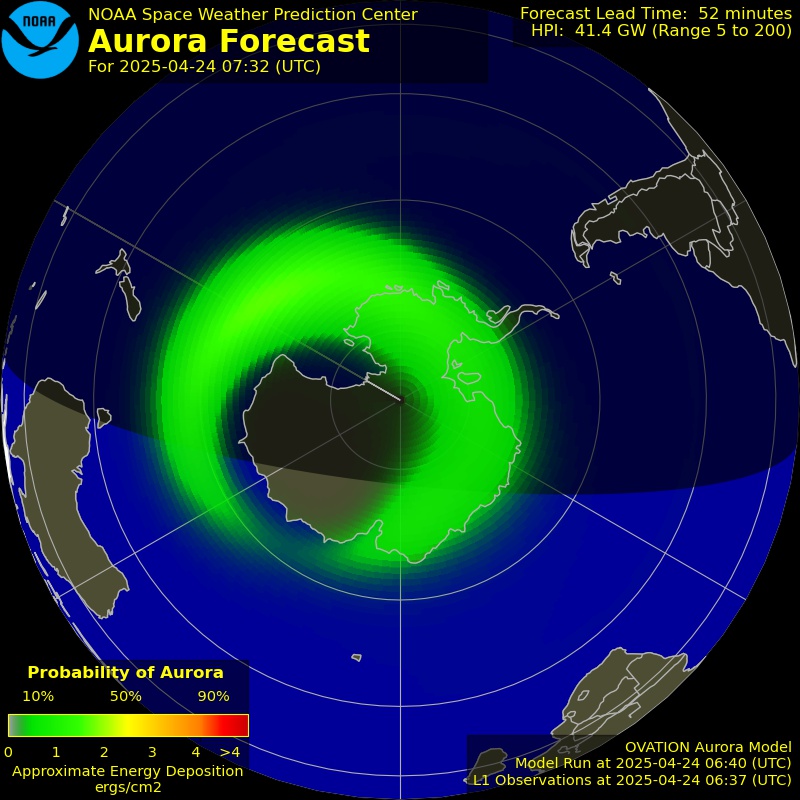
These plots show real time Aurora Forecasts.
|
|
|
|
|
|
|
 |
Radio Propogation

IPS Space Weather
Solar Activity Monitor
The monitor in the page heading provides a textual status of X-ray activity and refers to the X-Ray Flux graph at the top of the page.| NORMAL | Solar X-ray flux is quiet (<1.00e-6 W/m^2). |
| ACTIVE | Solar X-ray flux is active (>= 1.00e-6 W/m^2). |
| M CLASS FLARE | An M Class Solar Flare has occurred (>= 1.00e-5 W/m^2). |
| X CLASS FLARE | An X Class Solar Flare has occurred (>= 1.00e-4 W/m^2). |
| MEGA FLARE | An unprecedented X-ray event has occurred (>= 1.00e-3 W/m^2). |
Script courtesy of: Lee, formerly hosting MadALwx.
Graph base code courtesy of: jpGraph.
Graph base code courtesy of: jpGraph.


